My First Infographic!
Last Updated on
I’m a ‘learn by doing‘ guy, so I’ve always been curious about creating videos and infographics. As such, I thought it was about time I had a go at creating an infographic.
Visual.ly is the infographic site of choice, and the recently launched a new site area which allows users to create their own infographics.Despite how great this sounds, I was very disappointed at the limited functionality and scope to be creative, so I looked elsewhere. After a few searches, I came across Piktochart.com, which was perfect for what I needed.
There is an element of ‘infographic fatigue’ floating round the digital marketing industry at the moment, so please don’t hate me for adding another unnecessary one into the mix :). You can see the infographic over at https://visual.ly/get-creative-your-google-posts and you can read the full ‘10 handy social media tips‘ blog post over on the bigmouthmedia blog.


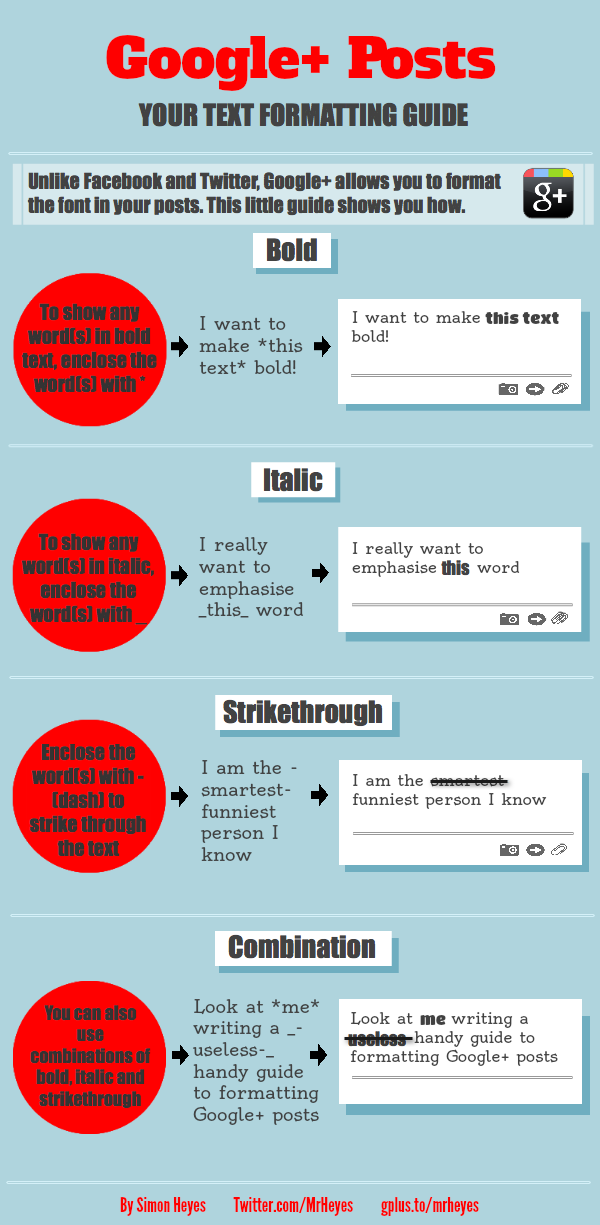
Nice inforgraphic. Just wondering, have you used bold again for italic?
Italic looks like bold. Shouldn’t it be at an angle?
Hi guys, thanks for the comments. You are correct – I noticed after the image was saved…for some reason the slant seemed to default back to bold…not sure why. It's my first infographic – I'll learn for next time 🙂